
Add an Annotation
Add annotations to your visualization to provide additional context to the data.
Overview
Sometimes a visual by itself cannot clearly communicate everything that is happening in the data. You can add annotations to provide contextual information that will help users interpret the visual and explain trends in the data.
For example, the following visual shows annual spikes in turnover. You can add event annotations to indicate that the increases in turnover coincide with your organization's semi-annual bonus payout.
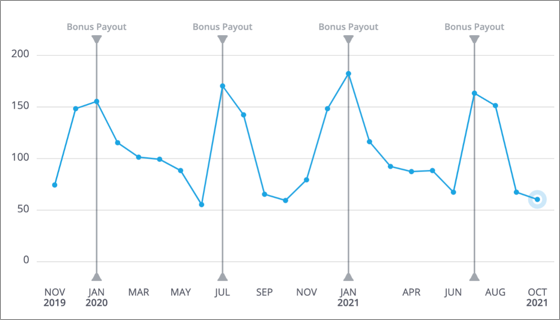
Viewers will instantly understand why the spikes are happening and there is probably no reason for concern.
Add and manage the annotations on your visual by clicking the Annotate button ![]() on the Visual Actions menu.
on the Visual Actions menu.
Add an event annotation
Mark important dates on your Trend and Trend Breakdown visual.
- Do one of the following:
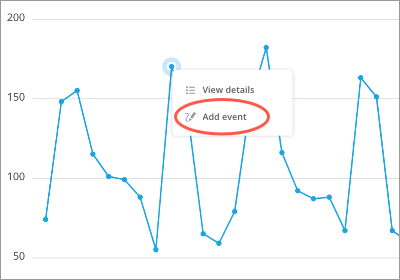
- To add an annotation for a chart item or data point, right-click on the chart item or data point and click Add event on the Visual Item Actions menu.
- To add an annotation for a date outside of the selected time window of your visual, click the Annotate button
 on the Visual Actions menu.
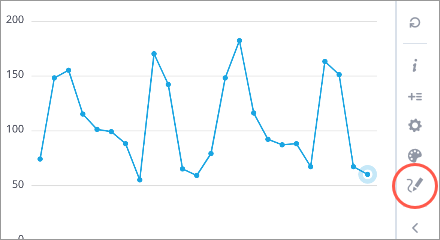
- To add an annotation for a chart item or data point, right-click on the chart item or data point and click Add event on the Visual Item Actions menu.
- Customize the annotation in the Add event panel by doing the following:
- Optional: Change the date by clicking the Edit date button
 .
. - Enter a display name.
Select the annotation color by clicking the Change color button
 . This will change the color of any text and markings associated with the annotation.
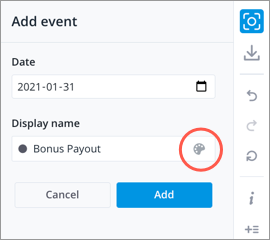
- When finished click Add.
- Optional: Change the date by clicking the Edit date button
- To add more annotations, repeat step 1 or click Add another event in the Event annotations panel.
Note: Event annotations will expand or collapse based on the selected time granularity. For example, you have event annotations for July 14, 2021 and July 29, 2021. If the time granularity of the visual is set to Weeks, the annotations will appear as two distinct points. When you switch the time granularity to Months, the annotations will collapse and the July data point will be marked as having 2 events. You can hover over the marking to see details about each annotation.